


Finding iPhone Memory Leaks: A "Leaks" Tool Tutorial
I’ve been using Instruments a lot lately as I approach the end of my game development cycle. I’ve found it especially useful for tracking down memory leaks in my game. I figured that since I found Instruments so helpful, it might be helpful for other people to get a quick introduction on how to use it to track mem leaks.
What is a memory leak and why should I care?
A memory leak is when your program loses track of a piece of memory that was allocated. The consequence is that the “leaked” memory will never be freed by the program. This usually happens when a piece of code does a “new,” “malloc,” or “alloc” but never does a corresponding “delete”, “free” or “release” respectively.
When you new, malloc, or alloc, what the Operating System is doing is giving your program a chunk of memory on the heap. The OS is saying, “here, have this block of memory at this memory address.” It expects you to hold a reference to that memory address (usually in the form of a pointer) and it’s relying on you to tell the OS when you’re done with it (by calling free, delete, or release).
Memory leaks happen when you throw away your pointer to that memory. If your program no longer knows where on the heap your memory is allocated, how can you ever free it?
So why should you care? In the most minor case, you’re wasting memory that will be freed when the user quits your app. In the worst case, you could have a memory leak that happens every frame. That’s a good way to end up crashing your program, especially if a user lets it run for a long time.
For more general information on memory leaks, have a look at Wikipedia for a start:
https://en.wikipedia.org/wiki/Memory_leak
How do I know I’ve got a memory leak?
Some memory leaks are easy to see by looking at your code. Some are much more difficult. This is where Instruments comes in. Instruments has a “Leaks” tool that will tell you exactly where you’re leaking memory so that you can get in there and fix it!
An Example App
I’ve created an example application that leaks memory in two places: in an Objective-C view controller, and in a C++ class I’m using in the app. The code is available from Github here. Below are excerpts from the code below that contain the leaks we’ll track down:
InstrumentsTestViewController.mm Excerpts
// Leaky excerpts - see GitHub for complete source

- (void)viewDidLoad {
    [super viewDidLoad];

    LeakyClass* myLeakyInstance = new LeakyClass();
    delete myLeakyInstance;

    mMyLeakyString = [[NSString alloc] initWithUTF8String:"I'm a leaky string."];

    [self doSomethingNow];
}

- (void) doSomethingNow
{
    mMyLeakyString = [[NSString alloc] initWithUTF8String:
        "Look, another alloc, but no release for first one!"];
}
LeakyClass.mm Excerpts
// Leaky excerpts - see GitHub for complete source

LeakyClass::LeakyClass()
{
    mLeakedObject = new LeakedObject();
}

LeakyClass::~LeakyClass()
{
}
I’m going to go ahead a build my InstrumentsTest iPhone app in Debug and get it running on my iPhone. (You’ll have to set up the code signing to work on your device.) Once I’ve done that, I’ll boot up Instruments (typing “Instruments” into Spotlight should find it).
Instruments
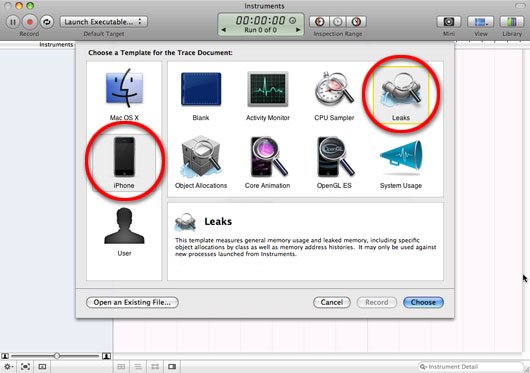
When you launch Instruments, you should be given the chance to select from a variety of different Instrument tools to use. On the left-hand side, choose iPhone. On the right-hand menu, double-click the “Leaks” tool:
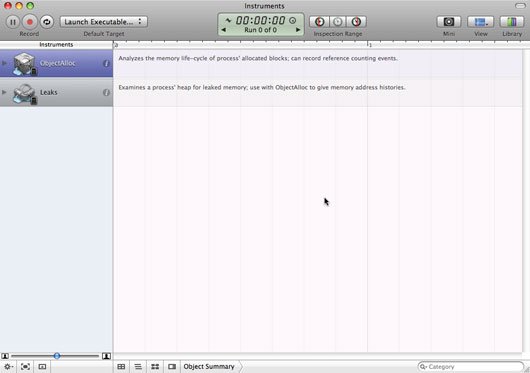
Once you’ve done that, you should see a window that looks like this:
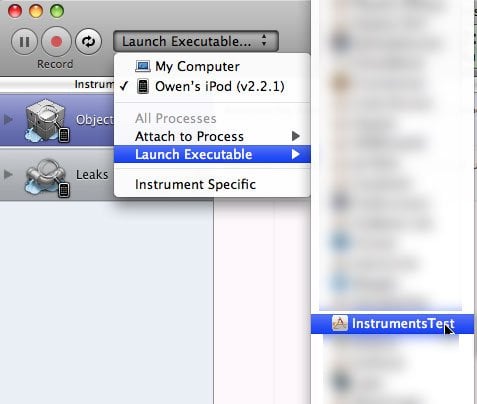
Make sure your iPhone is still connected to your computer. In the top-left corner of the window you’ll see a drop-down menu that says “Launch Executable”. Click on that and make sure that your iPhone (not your computer) is selected as the active device. Then scroll down to “Launch Executable” and you should see a list of all the apps that are installed on your iPhone. Find the app that you want to run “Leaks” on (in this case, InstrumentsTest) and click it.
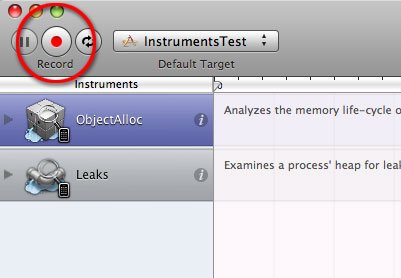
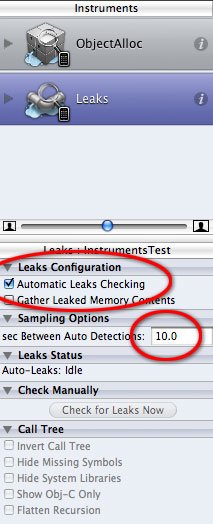
You’re now ready to go. Click on the red “Record” button and it will launch your application for you and start recording every memory allocation you do. It will also automatically check for leaks every 10 seconds.
You can change how often the automatic leak check runs, or you can set it to run only when you tell it too (when it checks for leaks, the entire app will freeze for about 3-5 seconds, so it can be annoying if you’re trying to play test and check for leaks at the same time). What I usually do is set it to manual control, and then hit the “Check for leaks” button whenever I need to (e.g. after loading a new game mode, after quitting the game back to the main menu, etc). Click on the Leaks row and use the View -> Detail button in the top right corned of the window to set/view options. For this example, I’m going to leave it on auto.
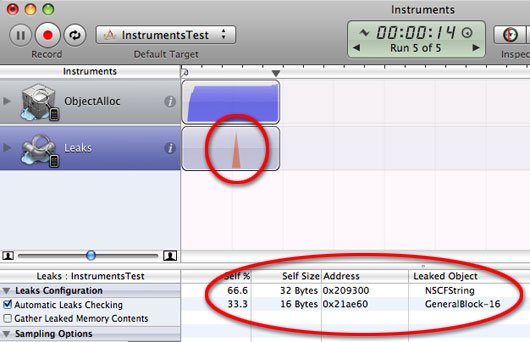
After the app has run for a few seconds, the auto leak check will run and lo and behold, it has found two memory leaks! Fantastic! What do we do now?
Extended Detail View
Instruments is very sneaky: it doesn’t make it obvious what to do next. What you need to notice is that row of buttons along the bottom of the window. See that little one made up of two rectangles? Hover your mouse over it and it will say “Extended Detail View”. (Note: You can also open this via View -> Extended Detail)
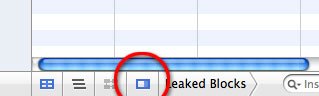
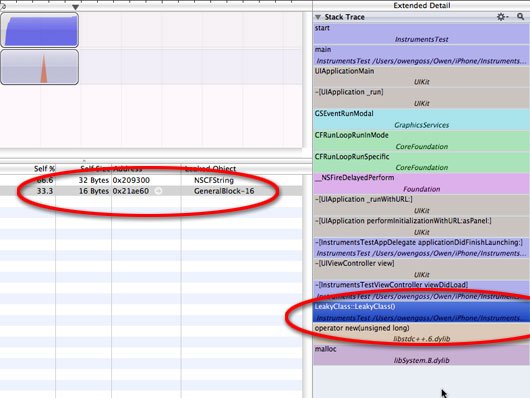
Click that button and a window opens up on the right-hand side of the screen that provides all kinds of handy details about your leaks!
Click on one of the memory leaks. The Extended Detail View will show you a complete stack trace to the point where your leaked memory was allocated. In our example above, clicking on the first leak reveals that a leak occurred inside [NSString initWithUTF8String]. If you look one step higher in the stack trace, you’ll see the last call inside my app was to [InstrumentsTestViewController viewDidLoad].
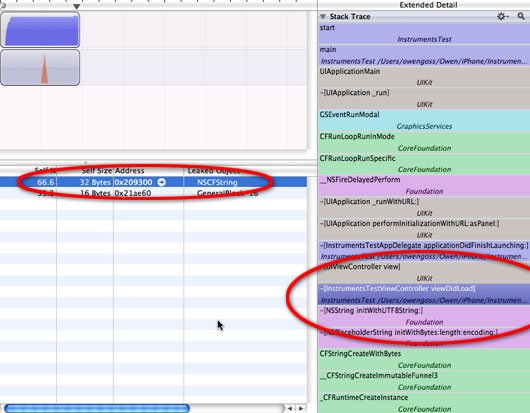
Here’s the really cool part, double-click on that line in the Extend Detail View and it opens an XCode window right to the culprit!
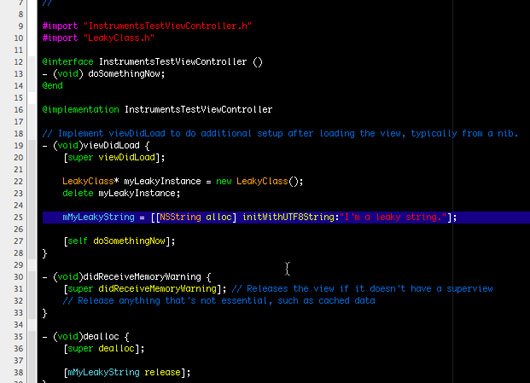
In this case we see that it was the first NSString allocation that leaked. Here’s where you need to do a bit of detective work. This is an extremely simple case, but it can get more tricky to find out why something’s leaky. Let’s take a closer look at our example.
In viewDidLoad we allocate some memory for the string, like this:
mMyLeakyString = [[NSString alloc] initWithUTF8String:"I'm a leaky string."];
And in dealloc, we release it like this:
[mMyLeakyString release];
So your immediate reaction might be that there shouldn’t be a leak. However, let’s search the code for all references to mMyLeakyString. That turns up this line inside doSomethingNow:
    mMyLeakyString = [[NSString alloc] initWithUTF8String:
        "Look, another alloc, but no release for first one!"];
Notice that we’ve allocated a new string and assigned the pointer to mMyLeakyString. The problem is that we never released mMyLeakyString before it started pointing to something else. So the original string is now floating around on the heap and we have no way of freeing that memory. What the release call inside dealloc is actually doing is freeing the 2nd string that we allocated in doSomethingNow, because that’s where the pointer is pointing.
So, to fix this, we might change doSomethingNow to something like this:
- (void) doSomethingNow
{
    [mMyLeakyString release];
    mMyLeakyString = [[NSString alloc] initWithUTF8String:
        "Look, another alloc, but released first one!"];
}
What this does is release the first string we allocated before we point mMyLeakyString to our new string. When you build and run your app in Instruments again, you’ll see there’s one fewer memory leak. Of course, there are probably some better ways to handle NSStrings in your project, but if you had to do it this way, this would fix it.
Let’s take a look at that second leak. Clicking on it again reveals the callstack of what led to the leak. Finding the last call inside our app shows that the leak came from inside the LeakyClass::LeakyClass() constructor:
Double-click that in the stack and it opens up the culprit in XCode again:
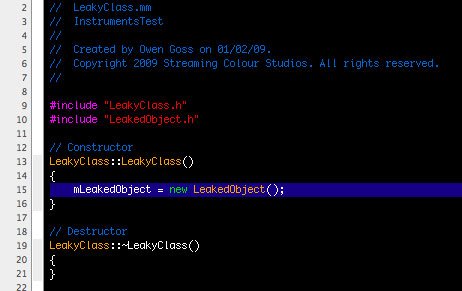
Here we see the constructor does a new of a LeakedObject. But what’s this? The destructor never deletes the pointer? Well that’s no good! For every new, there needs to be a corresponding delete! So let’s change the destructor to this:
LeakyClass::~LeakyClass()
{
    if (mLeakedObject != NULL)
    {
        delete mLeakedObject;
        mLeakedObject = NULL;
    }
}
Build and run your app through Instruments again and you should be memory leak free!
I’ve chosen these two examples, even though they’re both very simple, because they show that Instruments can be used to track down memory leaks both in your Objective-C objects, as well as your C++ classes that are integrated into your app.
So go forth and fix your memory leaks! Because remember, a mem leak-free app is a happy app!

Great post! Just helped me shake out a leak in my iPhone app MotivationalQuotes!
Thanks!
The clang static analyzer is also indispensable for finding memory leaks. It prints a nice report with line-by-line commentary and suggestions for where objects should be released.
https://clang.llvm.org/StaticAnalysisUsage.html
Awesome introduction to Instruments, thanks!
Real quick:
I realize it’s just an example for the purposes of the article, but just for anybody who’s not too familiar with what’s going on here, some of the cocoa programming paradigms help you to avoid this particular situation altogether.
If you set up in your interface definition of the class:
@property(retain) NSString mMyLeakyString;Retain and release is handled for you. You can set the property to a new static string or from one of the NSString constructors without worrying that the old value is automatically released for you. The retained property puts a retain on the new value, a release on the old value, and then sets the ivar pointer to the new value.
Cheers!
Billy
Addendum:
retain and release is handled for you if you also set up the getter and setter methods and use them:
@synthesize mMyLeakyString;

...

- (void) doSomethingNow

{

  [self setMMyLeakyString:[[NSString alloc] initWithUTF8String:

“Look, another alloc, the original will be released!”]];

  // or, with synthesize in place:

  self.mMyLeakyString = [[NSString alloc] initWithUTF8String:

“Look, another alloc, the original will be released!”];

}
That last chunk of code has a memory leak.
If you do …
@property (retain) myLeakyString;
@synthesize myLeakyString;
self.myLeakyString = [[NSString alloc] init];
You get a memory leak. The reference count coming out of alloc is +1, going into the property it is now +2. Leaving your object on destruction puts it back to +1, which is a memory leak.
If you use this (bad) way of doing things, constantly referring to your own ivars through your properties, then you have to be sure to give them neutral reference count objects in the assignment.
self.myLeakyString = [NSString string];
Reference counting is a horrible scheme, and that people are still making these basic errors 13 years after they introduced this, shows how poorly thought out it was in the first place.
Really nice & very very helpful article for all iPhone developers.
Generally most of iPhone developers are aware about this tool “Instruments” but don’t know it provides these kind of facility!!!
Thank you very much Mr Owen Goss for sharing this knowledge.
Really good post … helped me a lot….. Thanks
I have a reported leak from the apple leak detector (have a cache of objects). The clang tool doesnt report it as a memory leak. If i fix the leak by releasing the object I will then get a bad access error. It appears that there are false leak errors from the tool. Has anyone else seen this issue or know if there can be false reports?
Thanks
Nevermind, just found that my init was getting called twice and the first set of objects created were in fact leaked.
Great article on using instruments to track down memory leaks. This can be quite a painful process but you are def giving people a jump-start!
Awesome tutorial! I already started to look into this leak tool but unable to proceed further till end… But now I am really thankful to Mr.Owen Goss for providing this great one!
You have a wonderful tutorial. Thanks a lot.
Thank you! The extended view is a life-saver. Wasted a lot of time before I read this and found out about it!
Bravo! Wonderful tutorial. On a whim, I went looking through my entire project for “alloc] init” just to see if I’d find anything suspicious. Sure enough, there were a few cases of “self.ivar = [[MyObject alloc] init]” (where ivar is a property with retain ability, giving the object a retain count of 2 vs 1).
I can only get four leaks to happen reliably, but my app is only spotted in one of them. In that case, it’s leaking somewhere near (or after?) I add an NSOperation to a NSOperationQueue. Everything’s alloc’ed/assigned/released just fine though, so I’m not sure what’s up. Then again, I spotted this on OpenRadar (though it’s for MacOS X, not iPhone OS):
https://openradar.appspot.com/7128141
Hmm …
What I’d love to (read: appreciate seeing) next is a tutorial on best practices for handling memory when it comes to viewWillDisappear, dealloc, and didReceiveMemoryWarning (among others) … and common pitfalls made with allocating/releasing memory, even though it might be done “properly”. This could be useful for handling runaway allocation (no leaks, just “legit” memory growth but also unchecked memory growth, which on an iPhone is no fun at all).
Dear Billy Gray,
I thought I read somewhere that allocated memory and pointers have to be retained and released manually for iPhone. Are your examples for iPhone or Mac OSX programming?
Regards,
Plumer
Nice tutorial.
Thanks
Wow
Thanks a lot, this tutorial is super helpful
Excellent write-up. Honestly, Leaks was quite intimidating, unlike most other apps from Apple (I know, Leaks isn’t an original Apple app, but still). I tried and could not figure out how to use it and pretty quickly gave up. This write-up solved that issue. I just found and fixed 6 leaks in one of my apps, literally in a matter of minutes after reading this write-up. So, thank you, thank you, thank you.
Plumber, you are correct, there is no garbage collection on the iPhone.
Wow! Thanks, I wasn’t sure if my app even had memory leaks and luckily it only had like 2, which made sense when i found them, but for someone starting out i was surprise how much I didn’t have, basically I forgot to note out old code.
what about leaks coming out of the library. I have a few leaks regarding avaudioplayer and coregraphics and though “leaks” detects it , it does not point out the line(cos its coming from the lib).
Guys and idea how to deal with this??
BK has a good point. I am also facing issues where there are leaks that are very hard to locate in my own code. I have done my best to follow proper memory management techniques. For example, details on a leak I have:
– Responsible Library: CoreGraphics
– Responsible Frame: open_handle_to_dylib_path
The only thing I can think of is that there is any issue with autorelease on cells in a table:
...

UITableViewCell *cell = [tableView dequeueReusableCellWithIdentifier:SectionsTableIdentifier];

  if( cell == nil ) {

    cell = [[[UITableViewCell alloc] initWithFrame:CGRectZero

                                   reuseIdentifier:SectionsTableIdentifier]

            autorelease];

  }

  cell.textLabel.text = [nameSection objectAtIndex:row];

  return cell;

}
This method is published in many iPhone books and I’ve seen it used in official iPhone Apple documentation. Is there any other way to deal with the cell variable and actually release it instead of using autorelease?
This tutorial has been very helpful. Explained clearly with nice illustrations. Thank you.