


iPhone App Buyers Survey — Revealed: Category Preferences, Price Sensitivity And Discovery Behavior
A sizable number of you reading this will have first heard of Mobile Orchard in the context some research we did connecting price and popularity in the App Store.
From the earliest days of the App Store until now, would-be moguls have had scant data to answer fundamental first principles questions like:
- What type of iPhone application do people want to buy?
- How much are people willing to pay for an application?
- How do people discover new applications?
Researchers at Compete (best known for Compete.com, its better Alexa) surveyed iPhone app-usage patterns to empirically answer those questions for a soon-to-be published report.
Compete provided us with early access to their data and I spoke with Danielle Nohe, Compete’s Director/Telecom & Media, about their findings.
Application Categories
Compete’s survey included two questions that illustrate different dimensions of category popularity. The first illustrates likelihood to download an app from a particular category, the second provides helps measures regular use within the categories. Be sure to read the commentary following the second question.
Survey Question: To the best of your recollection, which types of applications have you downloaded to your smartphone? Please select all that apply.
Results
| Category | % |
| Books | 23% |
| Business | 25% |
| Education | 23% |
| Entertainment | 78% |
| Finance | 32% |
| Games | 79% |
| Healthcare and Fitness | 19% |
| Lifestyle | 29% |
| Music | 55% |
| Navigation | 33% |
| News | 43% |
| Photography | 20% |
| Productivity | 27% |
| Reference | 28% |
| Social Networking | 35% |
| Sports | 23% |
| Travel | 29% |
| Utilities | 42% |
| Weather | 57% |
| Other | 2% |
Survey Question: Survey Question: Which 3 applications do you use the most often?
Results
| App | % |
| 25.1% | |
| weather | 22.7% |
| Games | 20.3% |
| The Weather Channel | 13.1% |
| Music | 10.8% |
| Calendar | 7.2% |
| shazam | 7.2% |
| backgrounds | 6.0% |
| 4.8% | |
| itunes | 4.8% |
| Lose It | 4.8% |
| AP News | 3.6% |
| Contacts | 3.6% |
| grocery iq | 3.6% |
| maps | 3.6% |
| Pandora | 3.6% |
| photo | 3.6% |
| Sol Free | 3.6% |
| Stocks | 3.6% |
| urban spoon | 3.6% |
| USA Today | 3.6% |
| Bank of America | 2.4% |
| Ebay | 2.4% |
| eReader | 2.4% |
| Evernote | 2.4% |
| finance | 2.4% |
| 2.4% | |
| gps | 2.4% |
| internet | 2.4% |
| myspace | 2.4% |
| news | 2.4% |
| NY Times | 2.4% |
| Restaraunt locator | 2.4% |
| SMS text | 2.4% |
| tetris | 2.4% |
| Tv.com | 2.4% |
| weather bug | 2.4% |
| YouTube | 2.4% |
| Accounts | 1.2% |
| Amazon | 1.2% |
| Arcada | 1.2% |
| around me | 1.2% |
| Banking | 1.2% |
| Bejeweled | 1.2% |
| books | 1.2% |
| brain age | 1.2% |
| business | 1.2% |
| cake mania 3 | 1.2% |
| calculator | 1.2% |
| checkbook | 1.2% |
| CITI | 1.2% |
| Currency | 1.2% |
| Dictionary | 1.2% |
| disneyland map | 1.2% |
| entrtainment | 1.2% |
| epocrates | 1.2% |
| flixter | 1.2% |
| Flycast | 1.2% |
| Fox Sports | 1.2% |
| France24 | 1.2% |
| Freecell | 1.2% |
| Fring | 1.2% |
| Fstream | 1.2% |
| Gem Spinner | 1.2% |
| Geopher Lite | 1.2% |
| Google earth | 1.2% |
| google maps | 1.2% |
| google mobile | 1.2% |
| Google Reader | 1.2% |
| Health and fitness | 1.2% |
| health calendar | 1.2% |
| HOPSTOP | 1.2% |
| iFitness | 1.2% |
| interest calculator | 1.2% |
| iSilo | 1.2% |
| Ithkar | 1.2% |
| itv | 1.2% |
| kindle | 1.2% |
| KPCC Radio | 1.2% |
| Link Four | 1.2% |
| Livestation | 1.2% |
| Livestrong | 1.2% |
| 1.2% | |
| MMS | 1.2% |
| msn | 1.2% |
| navigation | 1.2% |
| Nike fitness | 1.2% |
| Omnifocus | 1.2% |
| pacman | 1.2% |
| Phone | 1.2% |
| photo eye q | 1.2% |
| productivity | 1.2% |
| Public Radio | 1.2% |
| Quaran | 1.2% |
| radio | 1.2% |
| referencve | 1.2% |
| scloreboard | 1.2% |
| Scrabble | 1.2% |
| Search engines | 1.2% |
| sit or stand | 1.2% |
| Social networking | 1.2% |
| Sports | 1.2% |
| Sudoku | 1.2% |
| Tennis 09 | 1.2% |
| texas holdem | 1.2% |
| tip calculator | 1.2% |
| tipster | 1.2% |
| tmz | 1.2% |
| Trace | 1.2% |
| traffic cameras | 1.2% |
| Trapster | 1.2% |
| TWEETFON | 1.2% |
| 1.2% | |
| vlingo | 1.2% |
| woot watch | 1.2% |
| Word Warp | 1.2% |
| World View | 1.2% |
| yahoo weather | 1.2% |
| zenbe list | 1.2% |
Note that both “weather” (a category) and “The Weather Channel” (a specific app) are both in the top-3. This survey has been criticized by other journalists with whom they pre-released this data for their choice of wording in this question. I’ve got a different angle:
Some consumers so strongly associate e.g., the Weather Channel application with the weather-category as to be synonymous. To me, these are great brand-association metrics; I’d be unlikely to build a competitor to app that has come to represent the category.
Application Pricing
The two pricing-related questions in the survey illustrate the willingness of an iPhone owner to pay for an app in principle, and the top-amount they’ve paid for any application:
Survey Question: What Percentage of the applications on your smart phone were free applications?
Results
| Some (1%-50%) | 20% |
| Most (51%-99%) | 51% |
| All (100%) | 29% |
Survey Question: What is the most you have spent on a single application for your smart phone?
Results
| $.99 – $1.99 | 29% |
| $2.00 – $4.99 | 32% |
| $5.00 – $9.99 | 25% |
| $10.00 – $19.99 | 10% |
| $20.00 – $49.99 | 3% |
| $50.00+ | 1% |
Application Discovery
In what I think is the most interesting section of the results, the researchers asked about how people learn about new apps and how frequently people install from their computers (vs. directly onto the phone).
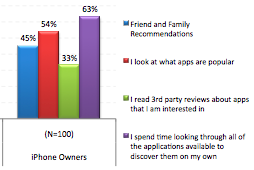
Survey Question: How did you decide which applications to download to your phone?
Results
| Friend and Family Recommendations | 45% |
| I look at what apps are popular | 54% |
| I read 3rd party reviews about apps that I am interested in | 33% |
| I spend time looking through all of the applications available to discover them on my own | 63% |
While it’s not possible given the methodology of this research, it’d be great to cross-tabulate this data to determine how much the friends-and-family recommendations overlap with popularity.
Survey Question: Which methods have you used to download applications to your smartphone? (Please select all that apply.)
Results
| Download content / apps on my PC and then sync with my device | 56% |
| Acquire content by browsing / purchasing via my device on my web browser | 25% |
| Acquire content by using an app store on my smartphone | 70% |
Given the relatively small percent of people installing applications discovered by the web and the limited options for exposure inside iTunes, maybe we need to start exploring more on-the-phone options for app discovery.
Conclusion
This is good stuff. We’re starting to fill in some of the gaps in our view of the market; we’re starting to be able to answer those questions at the head of this article with something other than the often-wrong conventional wisdom.
As we learn about more research like this we’ll make it available here. If you’re working on something related, let us know!

Very good stuff!!! Thank you for this data.
I’m surprised by the fact that customers say they buy on the iPhone as opposed to the desktop. Do they buy (buy is a strong word) because of how the App Store app is organized or with through ads on other iPhone Apps?
I’m not surprised they buy by looking through app and deciding on their own. I have felt this to be true for many months. And it doesn’t seem to fit with them buying on the iPhone.
I’m also surprised that recommendations are only slightly more useful than web sites.
Thanks for sharing this information. Really helpful!
Apple’s has recently had a lot of TV and print advertising for the iPhone in which specific apps are highlighted to illustrate the versatility of the device — “There’s an app for that!”
It would have been interesting to see some questions from Compete in the Discovery section to help gauge whether the advertising campaigns mainly help iPhone awareness/sales, general App Store awareness/sales, or sales of the highlighted apps.
Along the lines of:
• How did you find out about the App Store?
• Why did you download your first app?
• How often do you take the time to look for an app you’ve seen featured in Apple advertising?
As a marketer this survey as most, misses the mark. Who are these people? Do they skew male or female? I can go on and on about how this data is more or less useless beyond some high level cocktail/Starbuck’s chatter.